|
Market valuation is easy, it is what is moving in the market. If you find a subject property that you are interested in, yet you are curious to see if it is undervalued or overvalued, follow theses steps. 1+ Go to Realtor.com or Zillow or any site that can show you recent sales. 2+ create a radius around your subject property and look at all sales that have sold in the past 6 months 3+ Create a table in Excel showing the sold price and the square footage of the twenty properties. 4+ Create a scatter plot graph in excel where Sold Price is on the Y-axis, and Square footage is on the X-axis. Do this for at least 20 sold properties. 5+ Create a trend line on the graph. The trend line is the average price per square foot that is moving in the market. 6+ Match your prospective properties square footage to the graph and see where its price falls compared to the rest of the market. 7+ if your property is below the line, it is under valued and you will be able to offer more for the property, and if it is above the line it is over valued and you can offer less. 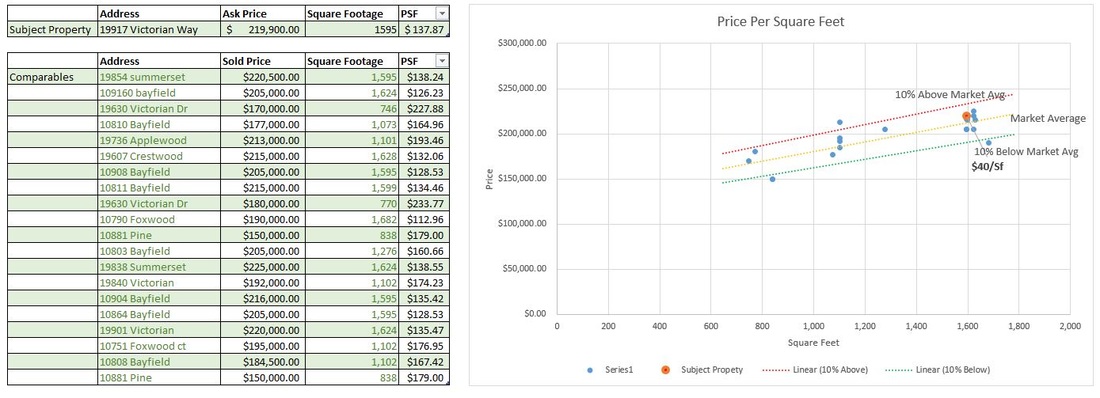
2 Comments
|
AuthorMr. Miller is a Graduate of Colorado State University who studied Corporate Finance and Real Estate ArchivesCategories |
 RSS Feed